Ups and downs
In a recent paper “The Impact of Unemployment Benefit Extensions on Employment: The 2014 Employment Miracle?” by Hagedorn, Manovskii and Mitman (HM&M) available here the authors say that they measure the effect of unemployment benefit duration on employment in the United States and find that cutting benefit duration leads to an increase in employment. One might think this means looking at whether the length of the period during which people can claim unemployment benefit affects their ability or willingness to get a job. Clearly that would be interesting, especially if it were capable of general application in other countries. And certainly some headlines suggest that this is what is understood. But it isn’t really this at all.
Across the USA, individual states set different limits on the length of claims to unemployment benefit. They don’t vary by much and the great majority set a 26-week limit. However, to help out during recession, federal funding schemes introduced from 2008 onwards enabled states to extend their limits if they wished. These were taken up with varying enthusiasm such that in 2013 almost all states would pay for at least 40 weeks and some states would pay unemployment benefit for up to 73 weeks. However the federal funding for came to an abrupt and unexpected end in December 2013, meaning everyone who was being paid under federal extensions will have exhausted their ‘underlying’ eligibility to unemployment benefit from their state. Thus when the federal extensions were not renewed, their benefits would have stopped. People who were already claiming but who had not yet reached the ‘underlying’ state limit would be paid only until reaching that limit, as would any new claimants from the beginning of 2014. For almost all states this is only 26 weeks.
HM&M divide states into two groups – those that had had a maximum benefit duration of over 54 weeks which they call ‘high benefit’ states, and those that had had a maximum benefit duration of 54 weeks or less which they call ‘low benefit states’. So high and low have nothing to do with the level of benefit paid, and it might have been clearer to call them ‘long benefit’ and ‘short benefit’ states. They then look at whether there was any difference between what happened to employment in these groups of states after the end of the federally-enabled extensions. They say that previously 'high benefit' states - i.e. those where the reduction in maximum length of claim was greatest - saw greater employment growth than 'low benefit' states.
So they are really looking at what happens if the maximum unemployment benefit duration is reduced from over 54 weeks to 26 weeks and comparing this with what happens if it is reduced from 54 weeks or less to 26 weeks. That doesn’t look as if it will provide a particularly useful insight in itself for all sorts of reasons.
Firstly, 54 weeks seems a fairly arbitrary division. There are two large clusters of states at 40 weeks and 63 weeks, and a smaller cluster at 54 weeks. If the line is drawn at 54 weeks, this splits the states into two groups that are closest in size to halves, giving a group of 24 states and a group of 27 states. If the line is drawn at the next point which is 49 weeks, that would give a group of 32 states on one side of the line and a group of 19 states on the other. The picture shows 'high' and 'low' in different colours and the grey shading shows the benefit duration to which each state reverted after withdrawal of the federal extensions. North Carolina alone is unchanged as this state was not using any federal extension.
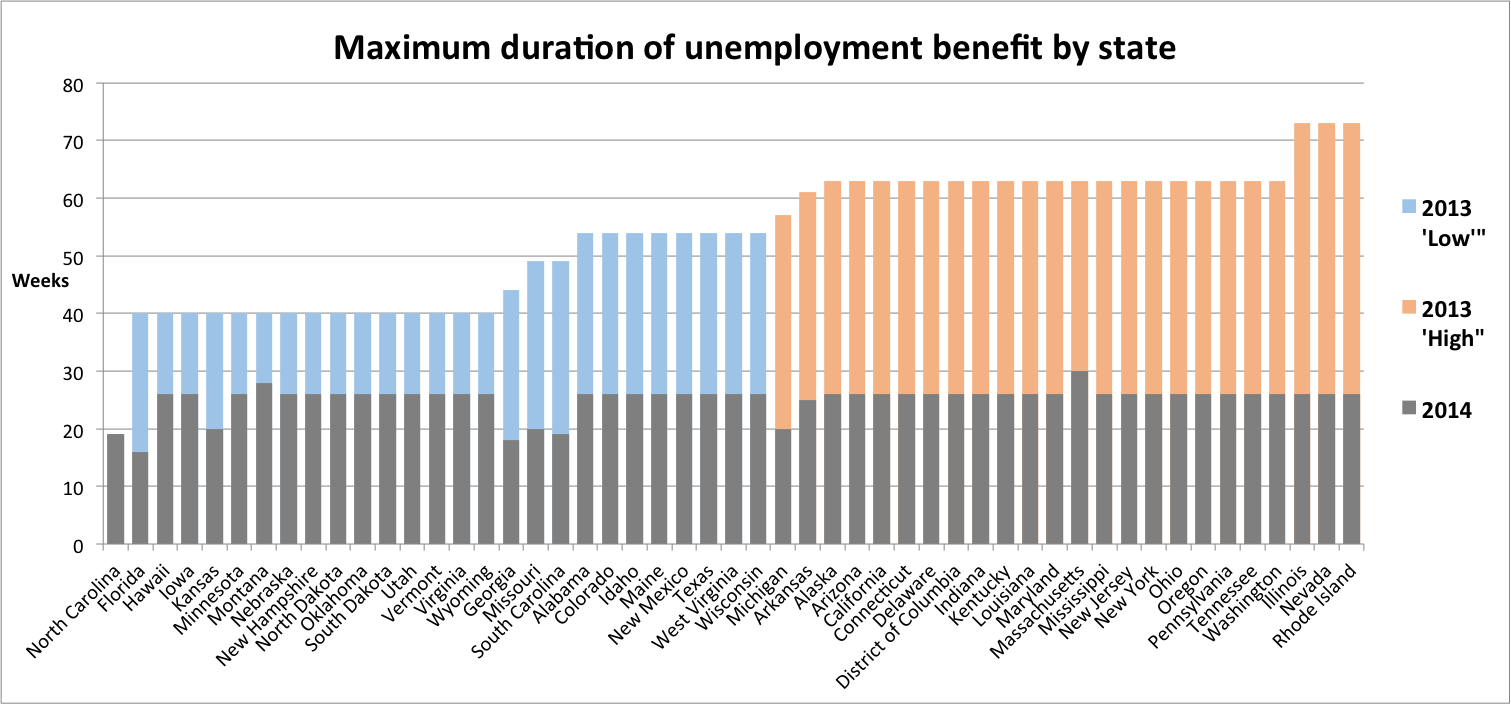
The reason a division into rough halves by numbers of states seems arbitrary is that a 54-week benefit duration is much closer to 63 weeks than it is to 40 weeks, and twice as long as the typical ‘underlying’ state duration so actually likely to obscure any relationship between previous benefit duration and employment change if the only comparison is between the groups en bloc.
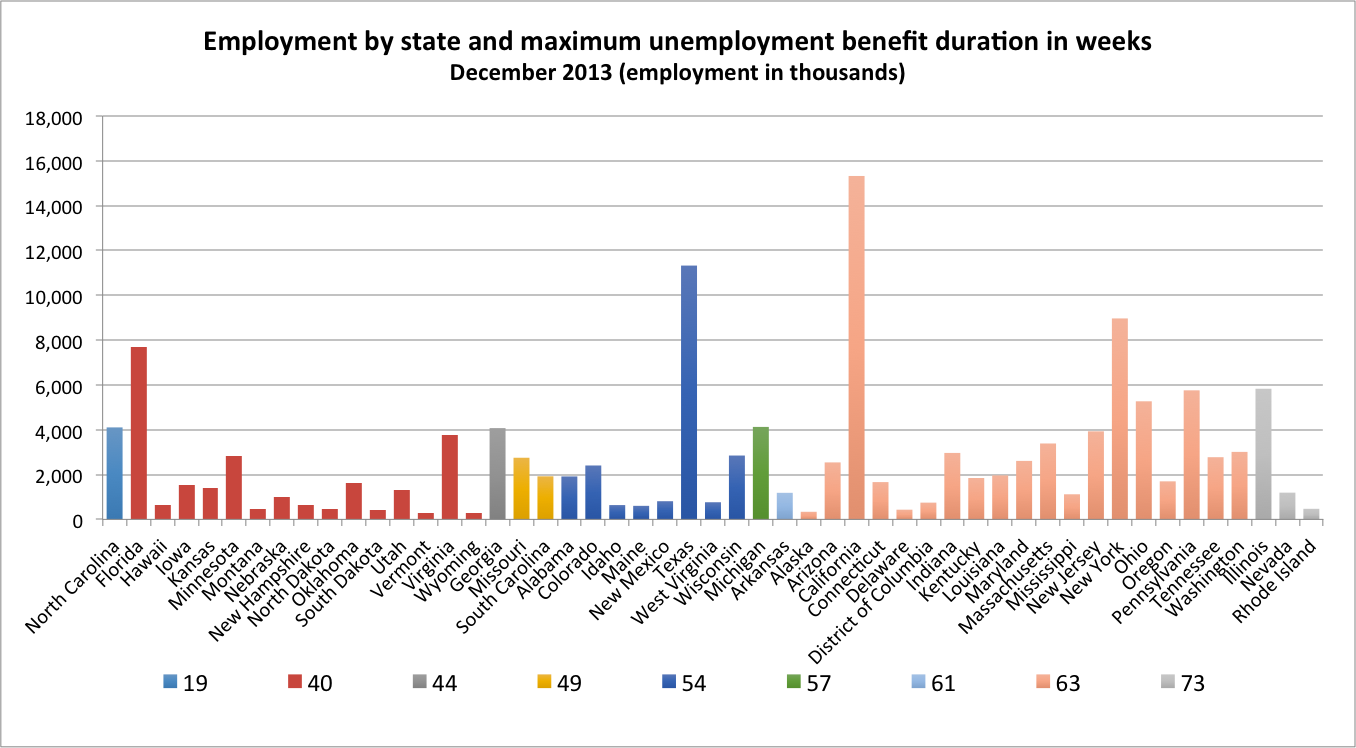
And as the picture illustrates, the states chosen as ‘low benefit’ comprise a rather smaller proportion of those in employment than the ‘high benefit’ states even though there are more of them.
The other reason why the division seems arbitrary is that it doesn’t seem that it would be any more difficult to look at the correlation between actual maximum length of benefit duration and change in employment level, rather than the assigned lengths of 63 weeks and 44 weeks which are simply unweighted averages of the maximum number of weeks during which someone could have been on unemployment benefits..
A simple plotting of maximum length of previous benefit duration against change in employment level from December 2013 to December 2014 suggests that states with longer maximum lengths saw slightly lower rates of employment growth. Obviously percentage change in employment is used as the states are of very different sizes.
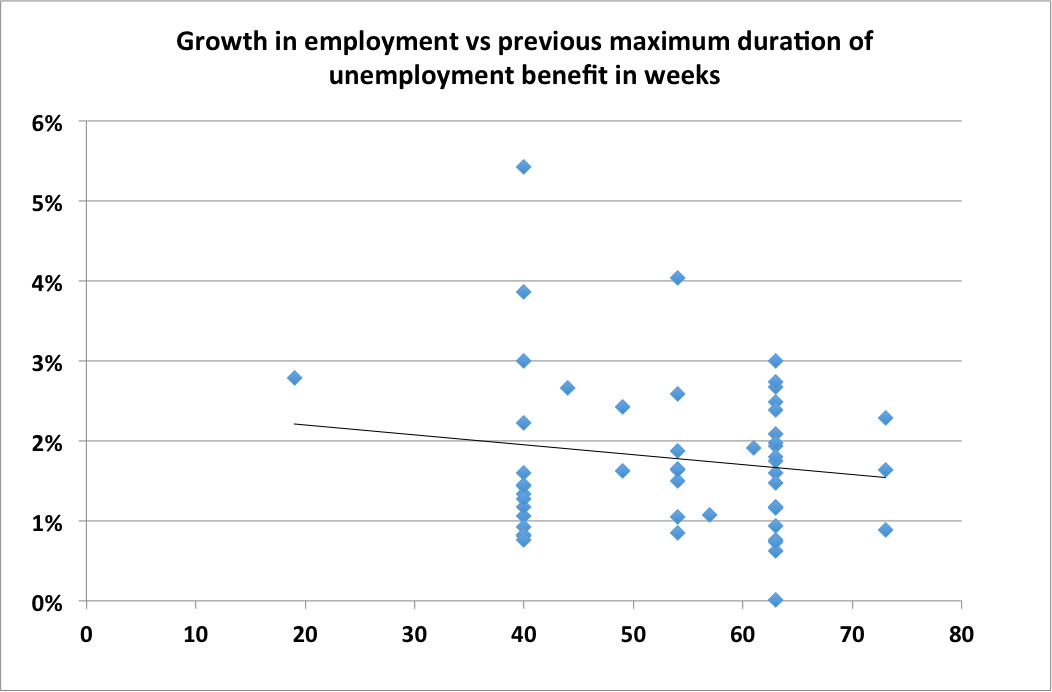
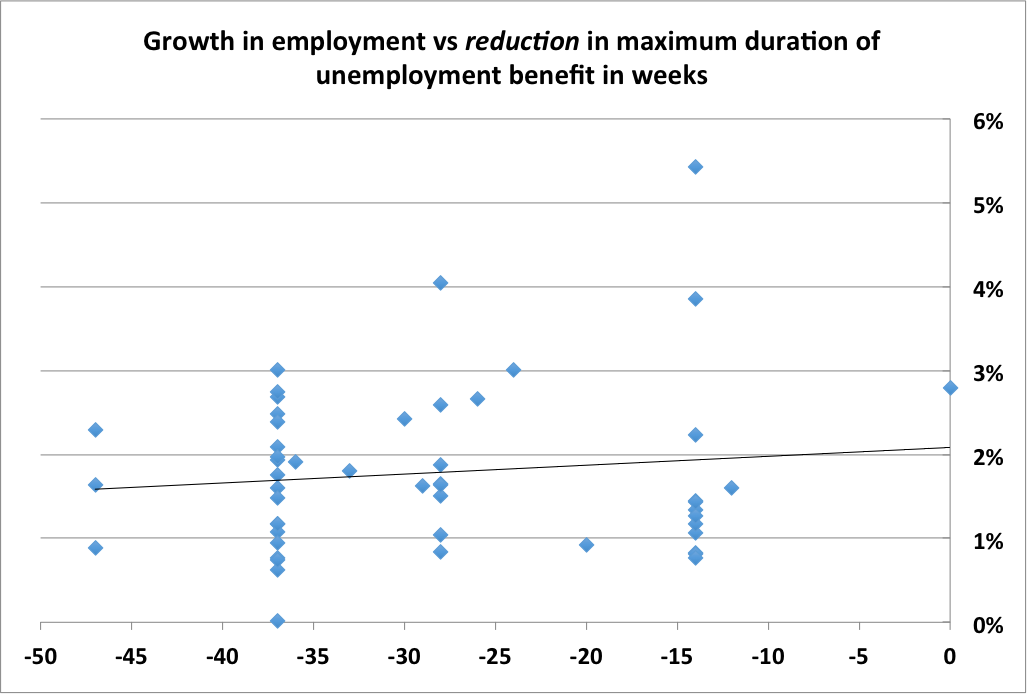
This is in line with Dean Baker's findings writing for CEPR here using a slightly different data series. A similar pattern is also shown if change in length of benefit duration is used instead of previous benefit duration.
It might also be noted that half of the total increase in employment occurred in just three states – California, Florida and Texas. Looking only at these three states, although increases of 2% in employment in California (with previous 63 week limit) and 3% in Florida (with previous 40 week limit) might appear to support the finding of an inverse correlation between previous limit and employment growth, Texas saw growth of 4% with previous 54 week limit. As noted above, it is arbitrary to put Texas together in a ‘low’ group with Florida rather than a ‘high’ group with California, and this makes a difference to the overall results if comparing 'high' and 'low' en bloc.
However, even if it were the case that there is a statistical correlation between employment change in ‘high benefit’ and ‘low benefit’ states, does this justify HM&M saying ‘We find that a 1% drop in benefit duration leads to a statistically significant increase of employment by 0.0161 log points'? Not really, because while employment has been observed, unemployment has not.
The variations in the enthusiasm with which states had adopted the federal extensions means that whereas the stock of unemployed as at December 2013 in ‘high benefit’ Nevada could have included people who had been receiving unemployment benefit for as long as 73 weeks, no one in ‘low benefit’ Kansas could have been receiving unemployment benefit for more than 40 weeks. But the researchers don’t seem to have taken account at all of what the actual level of unemployment in each state actually was, nor how this was distributed between those able to be claiming benefit only as a result of the federal extensions, and those who would have been able to claim anyway. The possibility of being able to claim benefit for any particular number of weeks by no means indicates the number actually claiming or for how long, and no evidence is produced or examined about the relationship between them.
If the evidence did show that the greater the cut in the maximum duration for claiming unemployment benefits, the greater the growth in employment, the intuitive reason for this would be that the ability to claim benefits for long periods enabled people who could otherwise work to choose not to work. But that could be tested only by looking firstly at the actual numbers taking advantage of the longer duration, which cannot be inferred from the mere possibility that people could, and secondly at the change in the numbers unemployed - which cannot be inferred from the numbers in employment.
The latter can be simply illustrated by looking at how unemployment and employment both changed during 2014. It is notable that immediately following the changes, unemployment levels did not actually drop at all despite employment increasing.
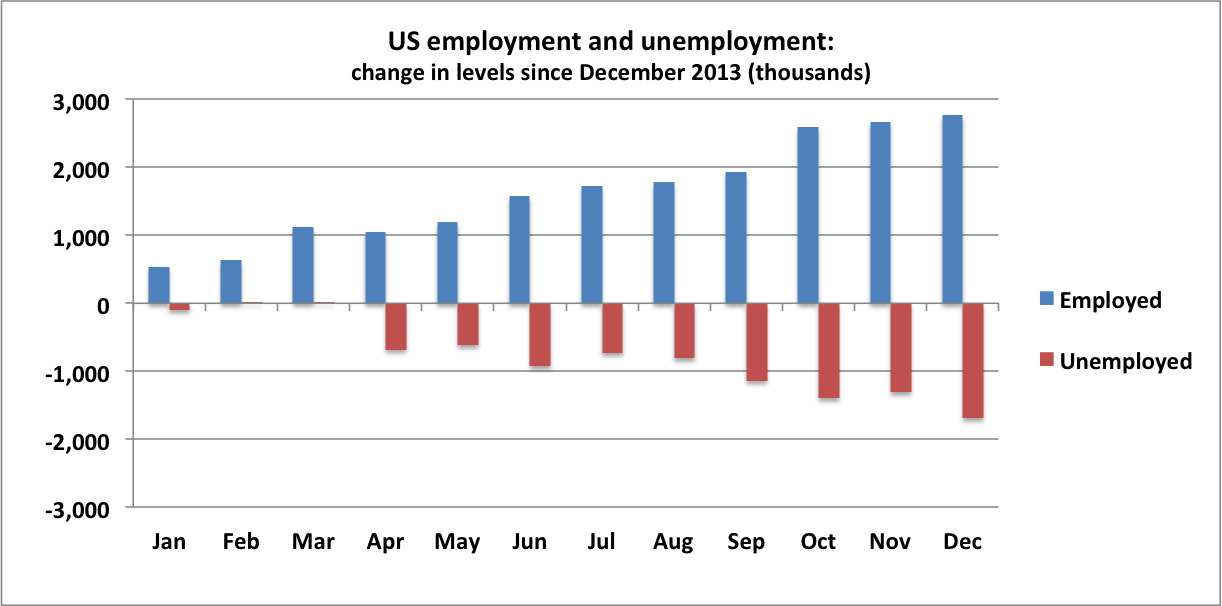
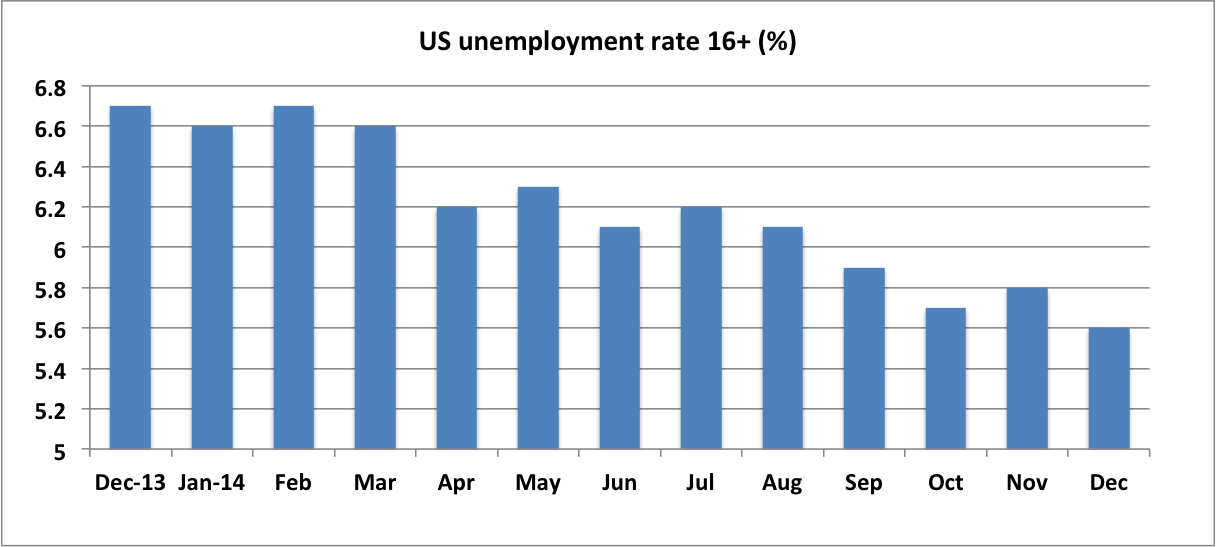
In fact, after not falling by much during 2012, unemployment had dropped quickly throughout 2013. But the first few months of 2014 saw that decline stop. That is, the curtailment of federal extensions to the duration of unemployment benefit claims at the end of 2013 was actually accompanied by an interruption to the downward trend in unemployment.
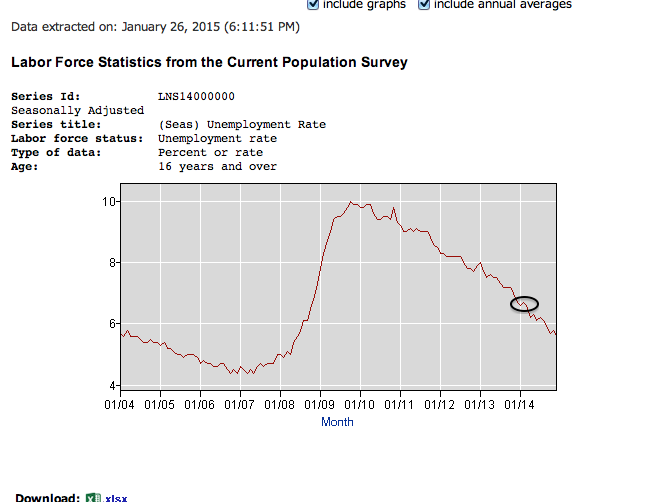
This can be seen more clearly in the picture below. HM&M neither note nor explain how this fits with their conclusion that reduction in previous length of benefit entitlement leads to growth in employment. It might be thought that it’s so obvious it doesn’t actually need spelling out – people went out and got jobs when their unemployment benefits stopped. Yet the figures appear to show something different. At the very least some explanation would be needed for the four-month lag in unemployment response (which applies to both rate and level).
Timing issues aside, HM&M do notice that the majority of employment growth did not come from reduced unemployment, saying “In levels, 1.8 million additional jobs were created in 2014 due to the benefit cut”. But they continue “Almost 1 million of these jobs were filled by workers from out of the labor force who would not have participated in the labor market had benefit extensions been reauthorized”.
Now it’s one thing to suggest that people who have their unemployment benefits stopped will as a result have gone and got a job. It is quite another to suggest that this caused the creation of more than that number of additional jobs. It is yet another to suggest that people who were not on unemployment benefits (and so who suffered no deleterious impact from their curtailment) chose to enter the labour market and find work because of cuts in benefits that they were not claiming.
So how could this happen? HM&M invoke academia here, saying “the primary labor market effect of a cut in unemployment benefit duration in the framework of Mortensen and Pissarides (1994) is the positive impact on job creation. It is this rise in job creation that leads in equilibrium to the increase in employment.
Now Mortensen and Pissarides are the epitome of reputable economists, having even won the Nobel Prize for Economics in 2010 for their work on search and matching theory in the labour market. But it might still puzzle ordinary readers. How can cuts in unemployment benefit cause new jobs to be created for people who were not claiming unemployment benefit?
HM&M say “Presumably this happened due to a large “macro" effect of the benefit cut on job creation. It is then the availability of jobs that drew non-participants back into the labor force.” So the benefit cut apparently caused more jobs to become available.
And they further say
[An] important finding in this paper concerns the effect of unemployment benefit duration on labor force participation. Prior to the reform, the consensus in the profession seemed to predict a negative impact of the cut in benefit durations on the size of the labor force. Instead we found that the reform led to almost a million non-participants entering the labor market. It seems plausible that they were encouraged by the improved probability of finding jobs due to the positive effect of the reform on job creation.” So the increased availability of jobs brought lots of previously inactive people into the labour market.
Well, this seems to be a clear misunderstanding or mis-statement of the Mortensen and Pissarides work that is referenced – “Job Creation and Job Destruction in the Theory of Unemployment” which says ‘Following the empirical literature, we say that job creation takes place when a firm with a vacant job and a worker meet and start producing; opening a new job vacancy is not job creation’
Obviously if this is how job creation is defined – a worker filling a vacant job – it is just another form of words for increase in employment. This is confirmed by the explicit statement that a rise in job creation is not a rise in the number of jobs available through the opening of new vacancies.
If your benefits being stopped means you really have no choice but to take any work on offer, it’s true that the result is job creation if it is defined by your taking a vacant job. But job creation so defined reduces the number of vacant jobs as the previously unemployed people take them. So the positive effect of stopping benefits on job creation, which is to reduce the number of vacant jobs, cannot possibly increase the probability of someone who is not active in the labour market finding a job. In fact, it decreases the probability by reducing the number of vacant jobs and so it can only be discouraging. Further, as the mathematics used by Mortensen and Pissarides show, people whose benefits have been stopped will fill vacant jobs at lower wage levels than they would have otherwise - although the mathematics merely explain the common-sense intuition that this will be so. All other things being equal, the bearing down on wages caused by a large number of people having their benefits stopped is likely to be extra discouragement to e.g. parent carers whose children are getting older and who are mulling a return to work.
So the Mortensen and Pissarides framework – certainly as they describe it themselves - provides no support whatsoever for the contention that stopping unemployment benefit could have increased the number of vacancies opened such as to encourage non-employed people into work. This means that HM&M’s statements that 1.8 million additional jobs were created in 2014 due to the benefit cut and that almost 1 million of these jobs were filled by workers from out of the labor force who would not have participated in the labor market had benefit extensions been reauthorized do not appear well-founded.
Unfortunately, while statements like this provide great headlines it should be clear that they can be very easily misunderstood if simply repeated. Not only do phrases like 'benefit cut' and 'job creation' not bear the meaning they might ordinarily be given (in the UK at least), but the actual substance of the assertions seems questionable too.