Reflections on revisions...
I looked at Chris Giles's spread of thirteen charts in the FT celebrating GDP returning to pre-recession levels a couple of months ago here.
Since then the Office of National Statistics has completed extensive revisions to the GDP statistics, concluding that the recession wasn't as deep as had been thought, and that we're in a better position now in 2014 too.
Geoff Tily commented on the new figures in the TUC's Touchstone blog, comparing change in GDP over the last four recessions, and saying
On the old ... basis the recession declined to an unprecedented extent and its recovery was slower than in any of the other post-war recessions (i.e. the line was below all the other lines ). On the new basis the extent of the decline was less atypical (though more abrupt), and the initial stages of the recovery were fairly in line with the two recessions that started in 73 and 79.
Translating this into real time, over the final years of the Labour administration in 2009 and into 2010, the economy was in a similar place to the two recessions that started in the 70s.
It held these gains in the early years of the Coalition, but fell decisively behind the experience of the 73 recession thirteen quarters after the peak =2011Q2, and the 79 recession fifteen quarters after the peak = 2011Q4.
Now presumably the Treasury will revert to type and explain this as the impact of the euroarea debt crisis on UK trade.
Geoff then proceeded to show why he doesn't think it's to do with trade (interesting but not my point here!)
Here is the picture of the recessionary and post-recessionary changes on the new basis.
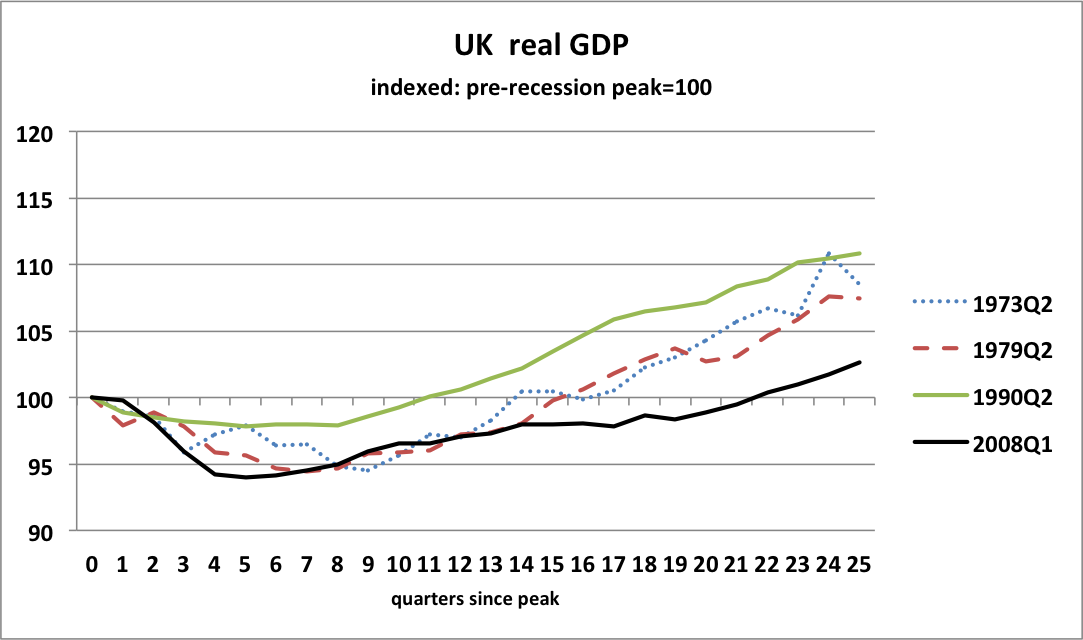
As Geoff points out, the upward trajectory under and immediately following Labour closely tracked growth following the 1973 and 1979 recessions, but then flattened off and fell behind.
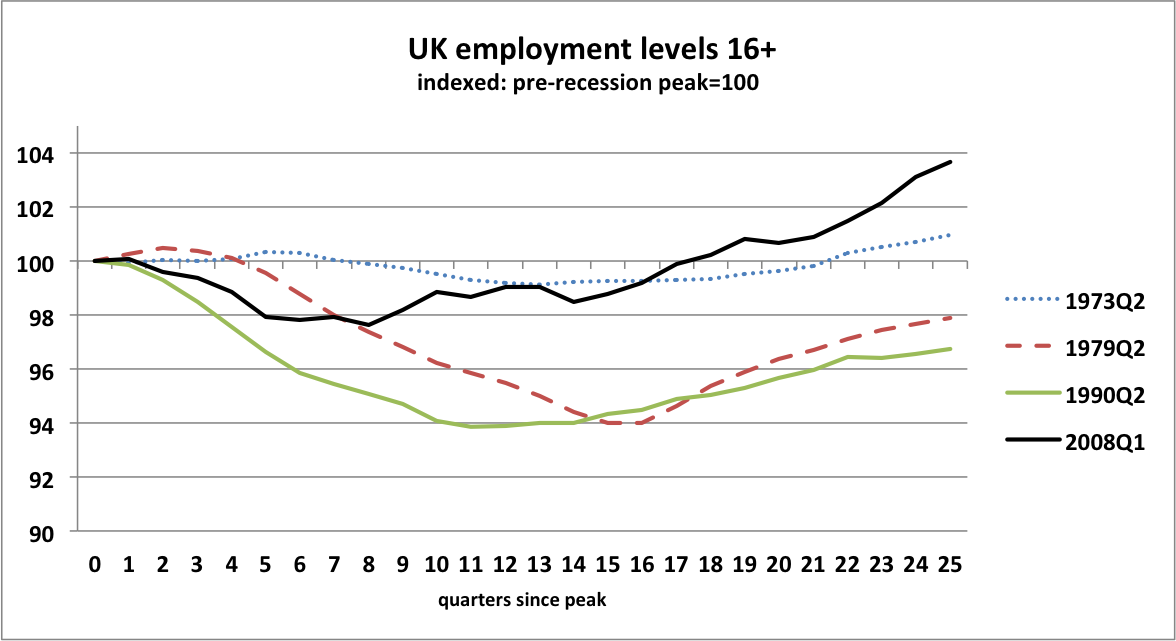
What I found interesting is that this happened more or less just as employment started growing strongly. What might also be interesting is the greater apparent employment loss from 1979 and 1990, and how GDP grew significantly above pre-recession levels while employment levels were still well below.
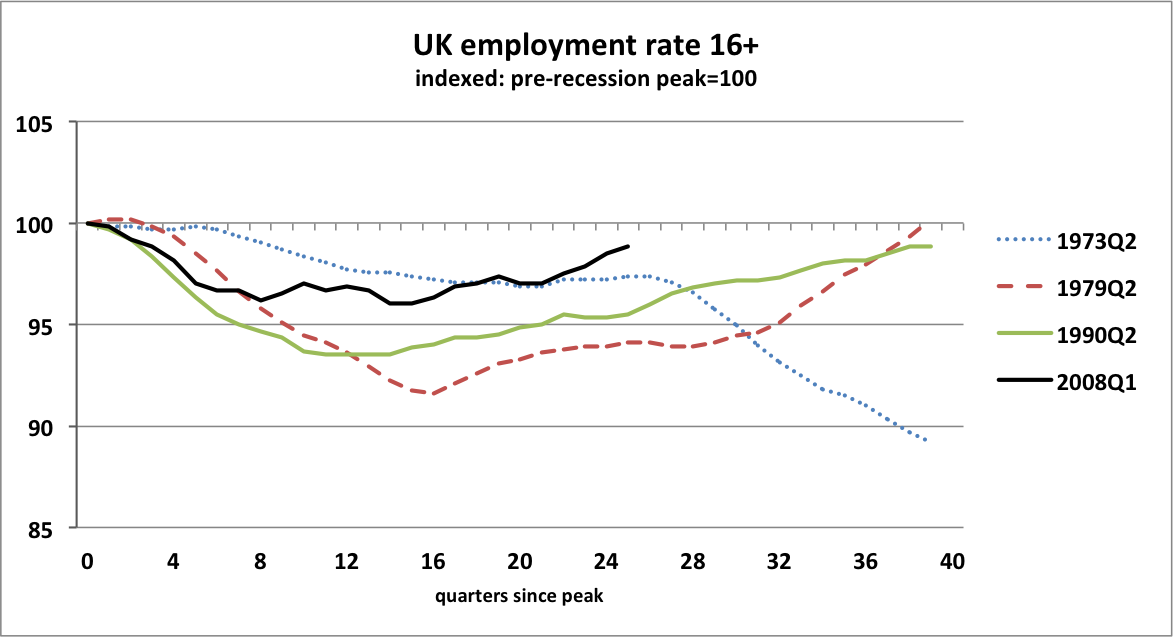
Now employment levels aren't the whole picture - the UK population growing quite quickly in the last few years, so let's look at rates. We can see that the 16+ employment rate is in fact still not where it was in 2008. But it's not far below. In contrast, following the 1979 and 1990 recessions, rates took nine to ten years to recover as much as we have since 2008. And the 16+ employment rate following the 1973 recession never recovered to previous levels.
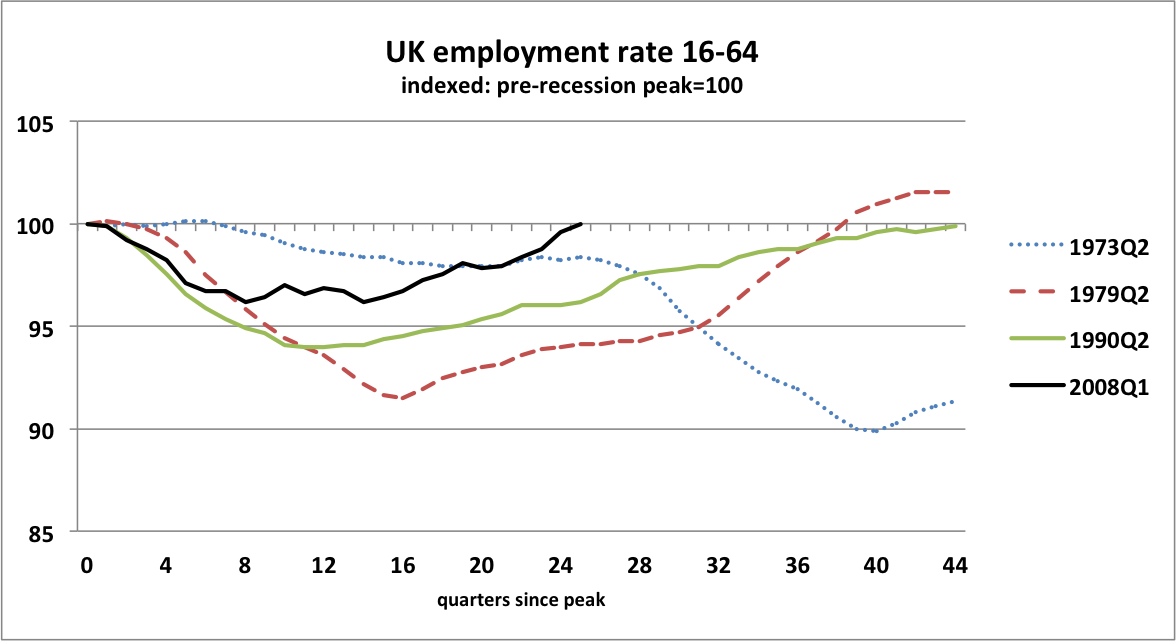
The usually quoted 16-64 rate shows a similar picture, except that we have actually just regained 2008 levels. It took nine years from 1979 and eleven years from 1990.
Putting together output and people lets us look at productivity. As I said last time I don't think that the ONS gave a very accessible illustration of this.
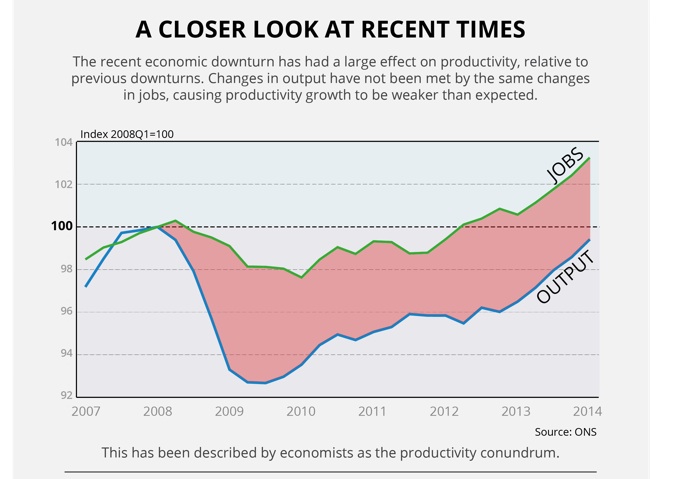
Putting producers (workers) and what is produced (GDP) together since 2008 gives a rather flat line, not an upward curve. Again in contrast to the soaraway lines - eventually - following previous recessions.
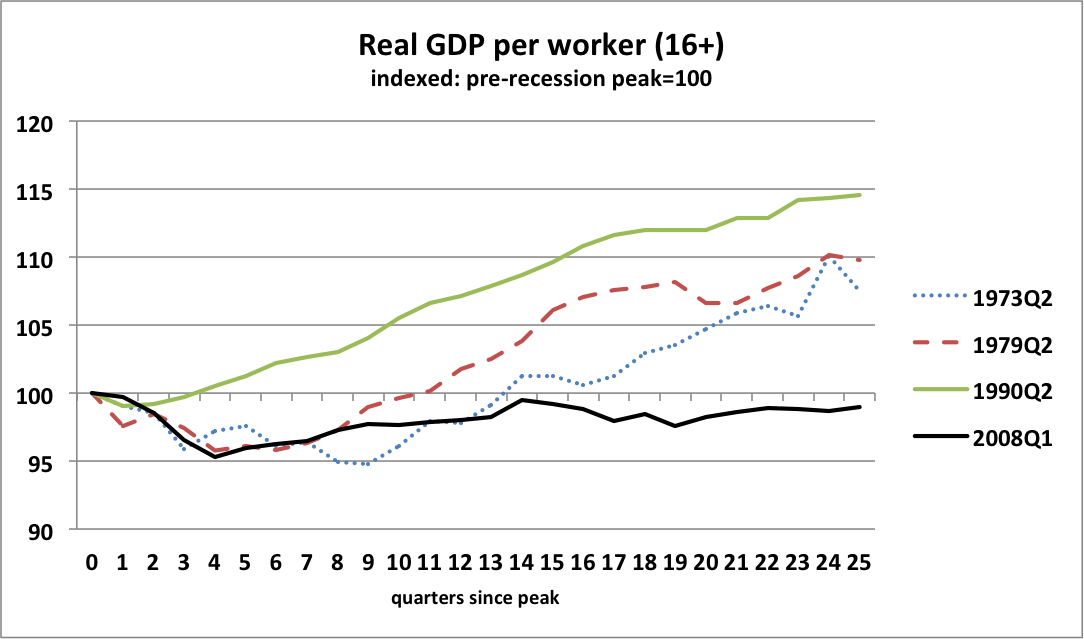
Now there might be issues around the changing composition of the workforce, part-time working etc, but the picture is little different if looking at output per hour worked.
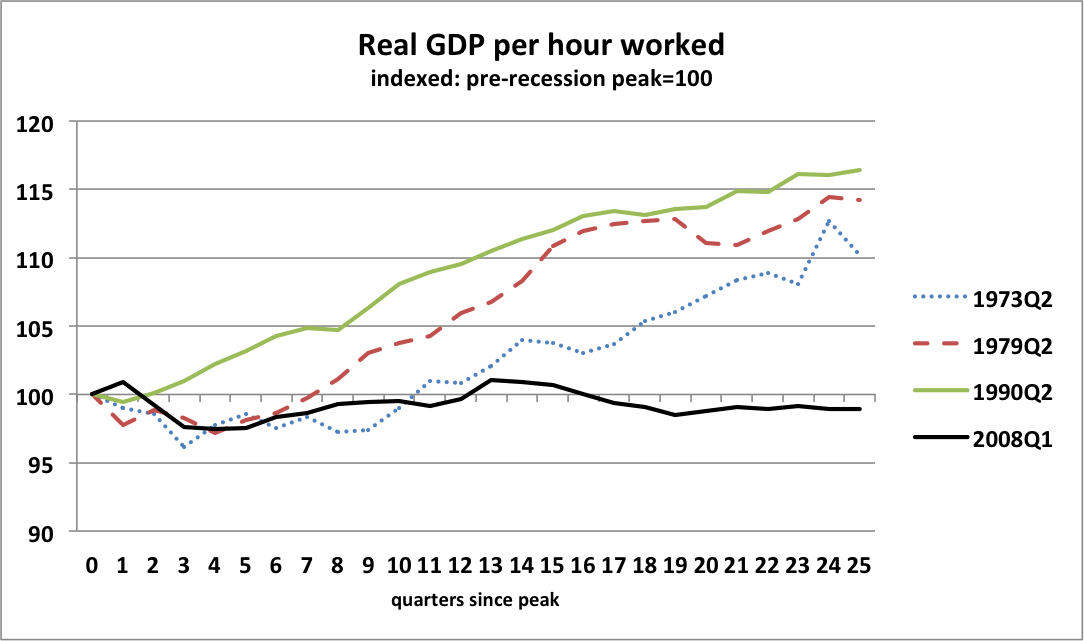
But remember that as shown above, at this point after previous recessions - 25 quarters on - both employment levels and employment rates were still well below pre-recessionary levels and well below where we are now compared to 2008. As @CCHQpress might have said "Fewer people in work with the security of a pay packet enabling them to look after their families".
So what price productivity?
prompts and links ...
Jonathan Portes
Writing in Financial World, Jonathan puzzles over the lack of productivity rebound from recession, and wonders whether ground has been lost permanently here.
Morgan Stanley
There are five key drivers of increases in UK self-employment. Overall these suggest the growth derives from weakness in the economy and is a sign of slack. Their report should download here.
Steven Toft (@FlipChartRick)
Increased self-employment doesn't appear to be necessarily a good thing, looked at internationally and macro-economically here
Simon Wren-Lewis
"Why strong UK employment growth could be really bad news" on Mainly Macro here
Ben Chu
Still room for scepticism over this 'glorious recovery' in the Independent here
TUC
The growth of self-employment is part of a trend towards casualised work, likely to hold back wages, and prevent people from having the kind of secure employment they need to pay their bills, save money and plan for the future here