Rose-tinted
Figures showing that GDP had returned to peak levels were greeted with a marvellous though paywalled spread of thirteen charts in the FT yesterday (25 July), but publicly tweeted too, with mostly jolly Chris Giles captions.
My eye was caught by this one.
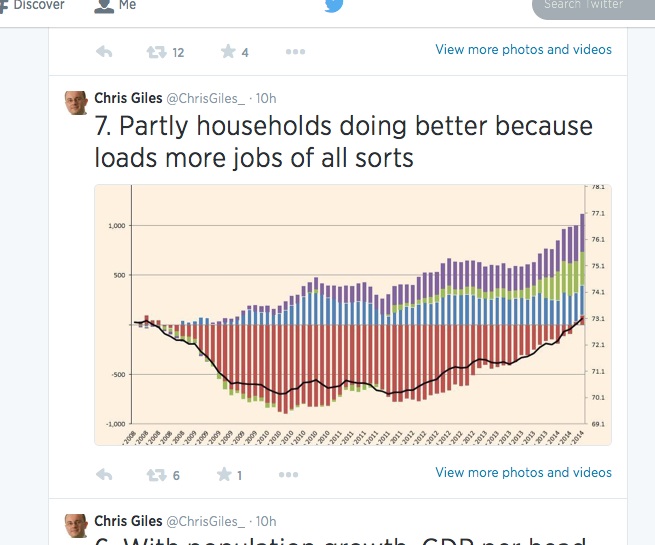
Now I’m not sure that this quite counts as loads more jobs of all sorts as full-time employee jobs are no higher than in 2008, and all of the more jobs are of the other sorts. Someone seemed to imply this might be a negative rather than a positive kind of thing the previous week.
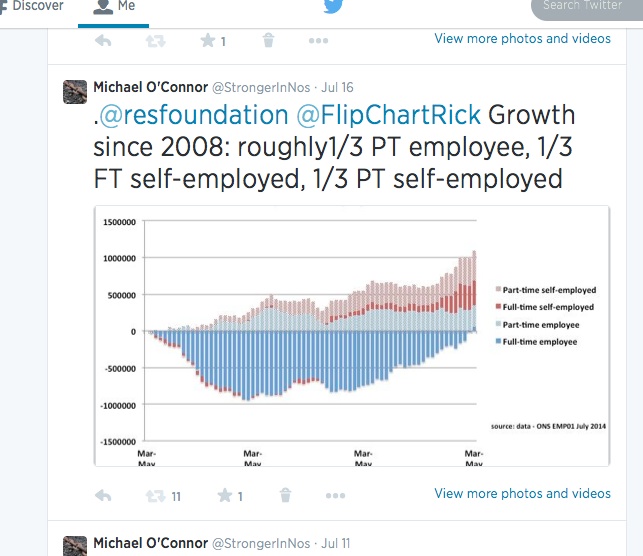
Apart from being more cheerfully coloured, Chris’s version does add something new, showing not just the numbers in work but the employment rate too. Great to see this back where it was – but it seems rather to undermine his point. Put plainly, what it shows is that the recovery of the employment rate to previous levels has been driven entirely by growth in numbers of people who aren’t full-time employees. That doesn’t mean there haven’t been any new full-time employee jobs created, but it does mean that no more have been created than have been lost. The population has grown considerably since 2008, yet the economy has been able to provide additional employment only in the form of part-time employment or self-employment.
As everyone knows, real wages have not really kept pace with anything else, even though they don’t include self-employed earnings which seem from other sources likely to have actually dropped. So as I’ve suggested before, the figures above look like they represent a great deal of continuing labour market slack, echoing the Blanchflower/Bell index of underemployment.
And in commenting on the GDP figures, @D_Blanchflower pointed out that GDP per capita was still some way from getting back to previous levels. Chris Giles did show this too but pointed to how it was ‘growing fast now’
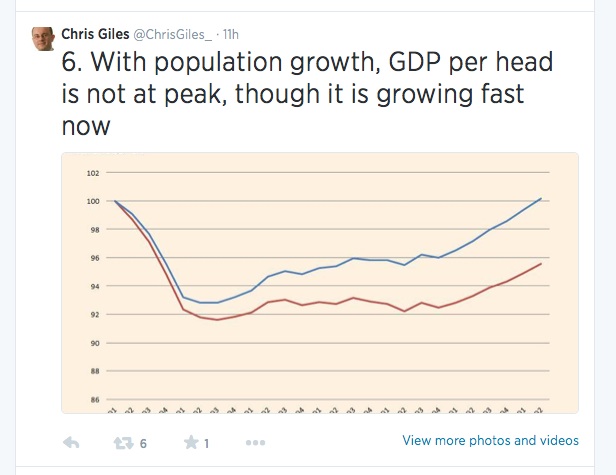
Well yes, but the recent pick up in the employment rate shows that the growth in employment is faster than growth in population. So what happens if we look not at GDP per head – which includes every adult and child in the UK – but at GDP per person in employment (coloured in hommage to Chris).
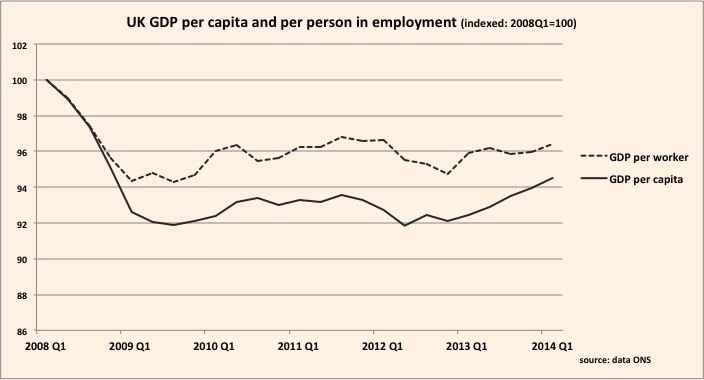
While this didn’t drop as much as GDP per head, it really hasn’t changed much over the last four years. And right now it isn’t growing by any means fast.
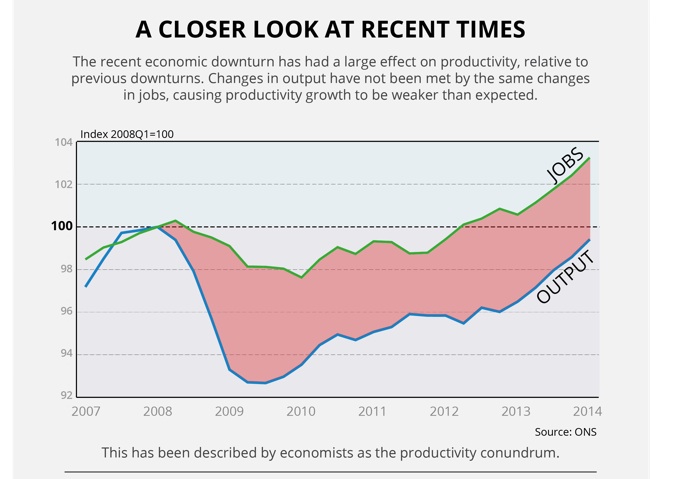
The Office for National Statistics displayed the same data in a different way, showing the difference between growth in jobs and GDP, rather than the ratio between them. For productivity growth output has to grow faster than jobs (or hours worked). The ONS curiously says changes in output have not been met by the same changes in jobs, when in fact since 2010 they largely have been, and that this is causing productivity growth to be weaker than expected. Well not really –the reason there isn’t any productivity growth is that jobs on average aren’t producing any more output than they did previously, so I can’t quite understand the cart before horse phrasing, especially in an infographic that I assume is (admirably) intended to make this stuff more accessible to people.
So if growth in employment is a triumph, it seems a triumph largely of quantity over quality and this is certainly an indicator worth watching for how well the economy is doing and about the nature and sustainability of renewed growth. Those taking some comfort from extrapolating the trend in GDP per capita growth to forecast that this too will return to previous levels in three years might consider whether this is likely to be true also for GDP per worker growth and whether it matters.
Finally, to be fair, numbers of full-time employees are on an upward trend. Though not by anywhere near enough even since the trough of 2010 to justify the @CCHQ strapline of n million extra pay-packets enabling people to look after their families. And quite a few of these pay packets have gone to new arrivals from abroad too
Signs of tightening might include not just a continued increase in full-time employees, but some rebalancing movement from the ‘other sorts’ of jobs. As to increasing productivity, that ONS infographic also showed the flattest productivity over the last year in the service sector …. far and away the largest part of the UK economy.
prompts and links ...
Jonathan Portes
Writing in Financial World, Jonathan puzzles over the lack of productivity rebound from recession, and wonders whether ground has been lost permanently here.
Morgan Stanley
There are five key drivers of increases in UK self-employment. Overall these suggest the growth derives from weakness in the economy and is a sign of slack. Their report should download here.
Steven Toft (@FlipChartRick)
Increased self-employment doesn't appear to be necessarily a good thing, looked at internationally and macro-economically here
Simon Wren-Lewis
"Why strong UK employment growth could be really bad news" on Mainly Macro here
Ben Chu
Still room for scepticism over this 'glorious recovery' in the Independent here
TUC
The growth of self-employment is part of a trend towards casualised work, likely to hold back wages, and prevent people from having the kind of secure employment they need to pay their bills, save money and plan for the future here